SpectroWorks™
Powerful web-based UV-Vis analysis software
Easy & Secure
Simplify Your UV-Vis Workflow and Save Hours In the Lab
SpectroWorks™ simplifies your spectrophotometer workflow to a three step process allowing you to quickly acquire, analyze and extract results.
It includes instrument light simulations for better performance and easy sharing of data to spreadsheets and electronic lab notebooks like Google Colab for further analysis and custom applications.
With 99.99 % uptime worldwide, SpectroWorks™ is a reliable tool for the analytical laboratory. SpectroWorks™ effortlessly analyses the data, so you can focus on the work.
Workflows for All Types of UV-Vis Analysis
Analyze All Cuvettes With One Platform
Basic Cuvette
With the basic cuvette workflow all standard UV-Vis measurements can be analysed for all types of plastic, glass or quartz cuvettes.
NanoCuvette™ One
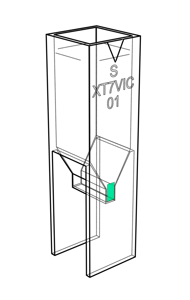
NanoCuvette™ One enables UV-Vis spectrophotometers to measure protein and enzyme concentrations and kinetics via refractive index down to 0.5 µL.
NanoCuvette™ S
NanoCuvette™ S enables UV-Vis spectrophotometers to measure particle and cell size distributions for 100 µL samples.
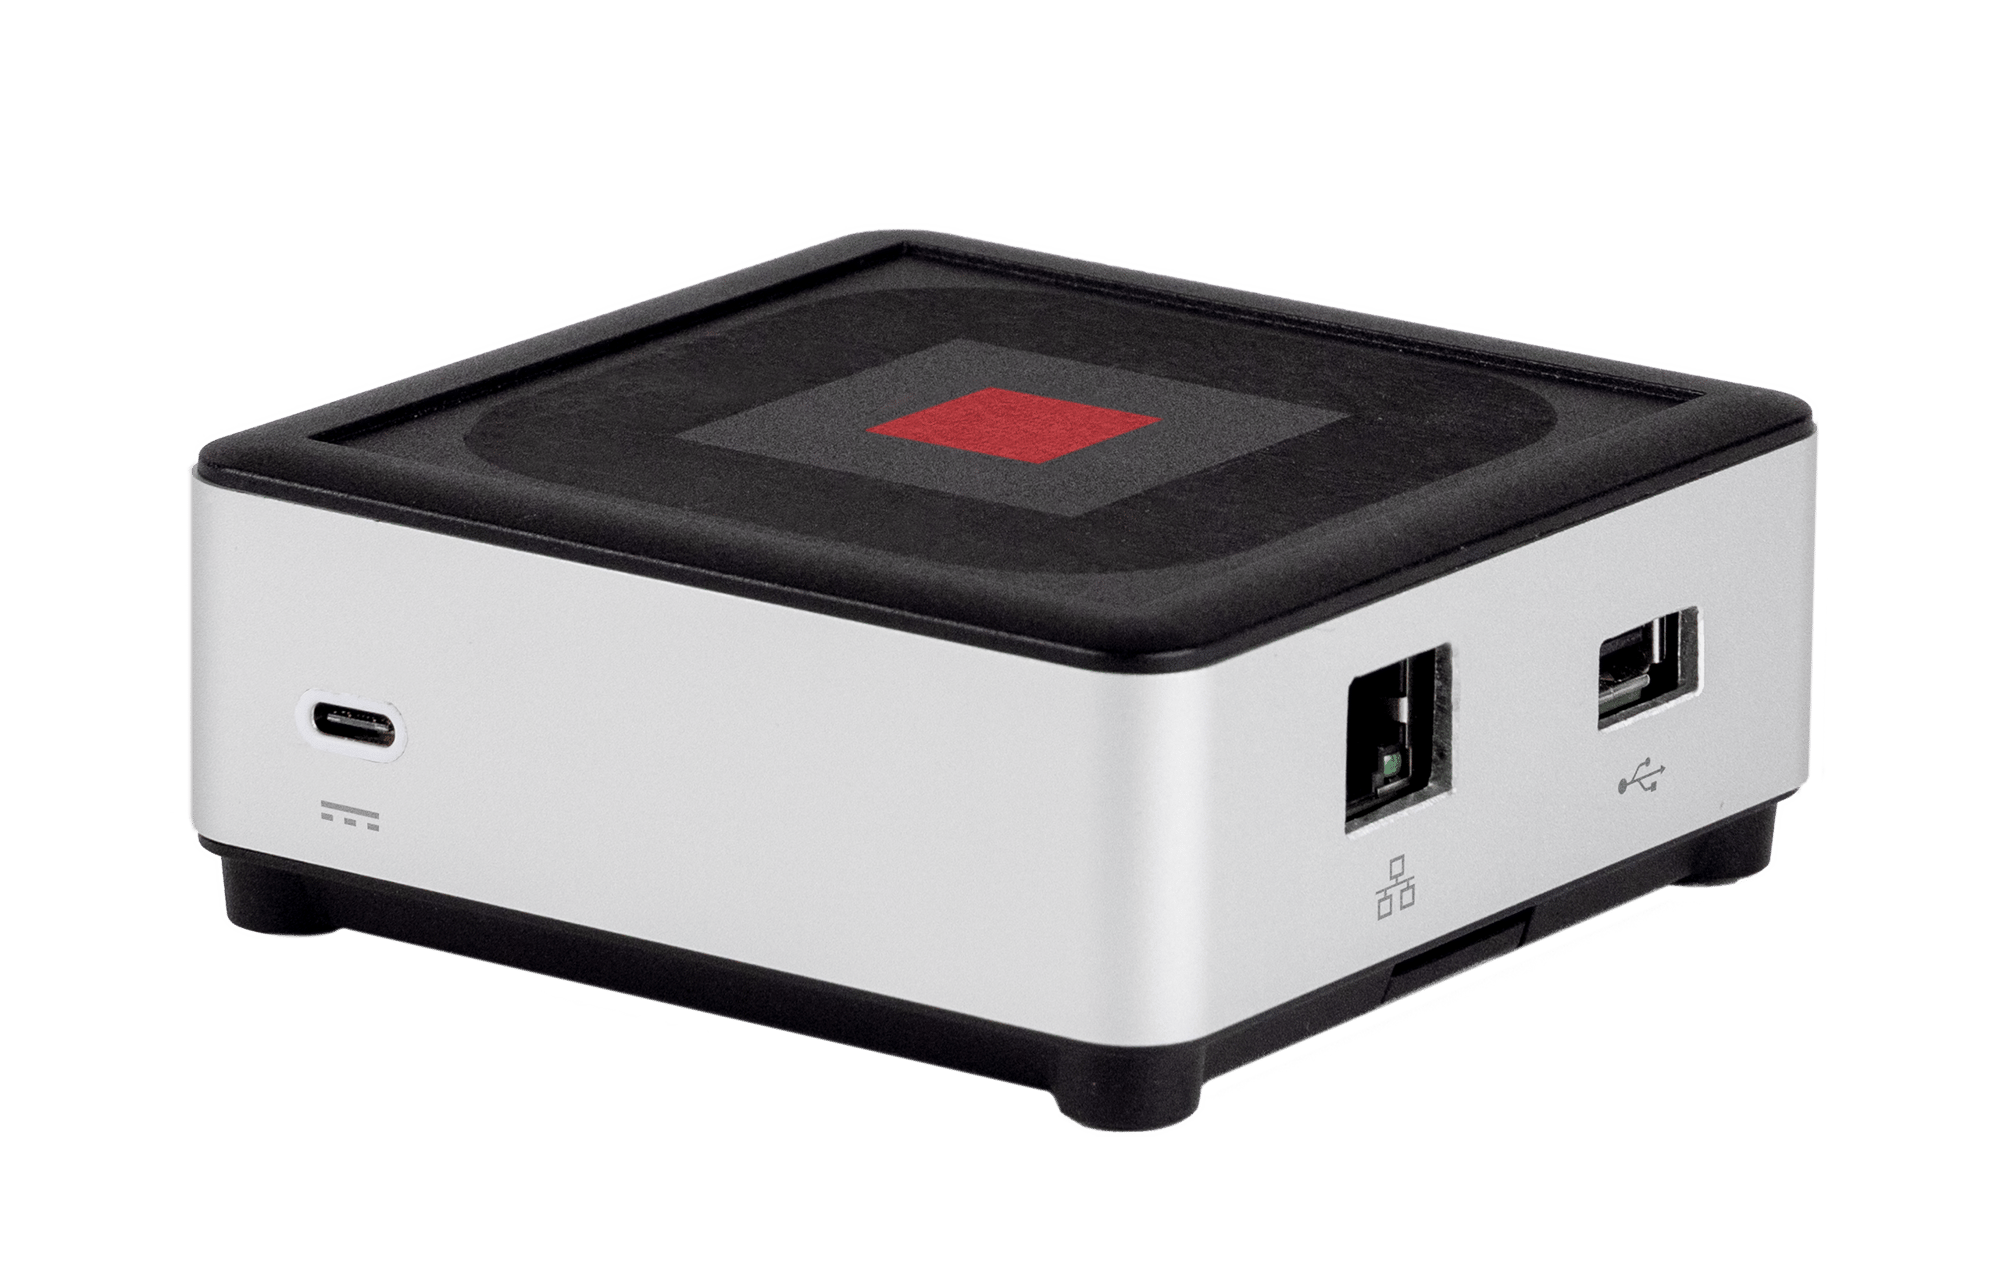
Regain Full Control of Your Instrument Again.
SpectroLink™
SpectroLink™ connects to a supported UV-Vis instrument and streams the data to SpectroWorks™, where the UV-Vis instrument can be controlled to do data acquisition, analysis and automatic reporting instantly as you go.
The days of old proprietary and platform dependent software is over. SpectroLink™ together with SpectroWorks™ take a huge leap in efficiency and user experience with a seamless integration.
SpectroWorks™ and SpectroLink™ lets you focus on the science and the work.
How It Works
Perform UV-Vis Analysis On All Devices
SpectroWorks™ is drag-and-drop easy to use on all devices. With SpectroWorks™ you can focus on getting things done.
Optionally, SpectroWorks™ automatically analyses the spectrum, corrects for optical path and cuvette misalignments by accessing 200 million calibration points. All this while giving back the results in no time.
After analysis, you can export the results in spreadsheet format or use API-keys to interface with other platforms, see for example our Colab python notebooks on standard curves.
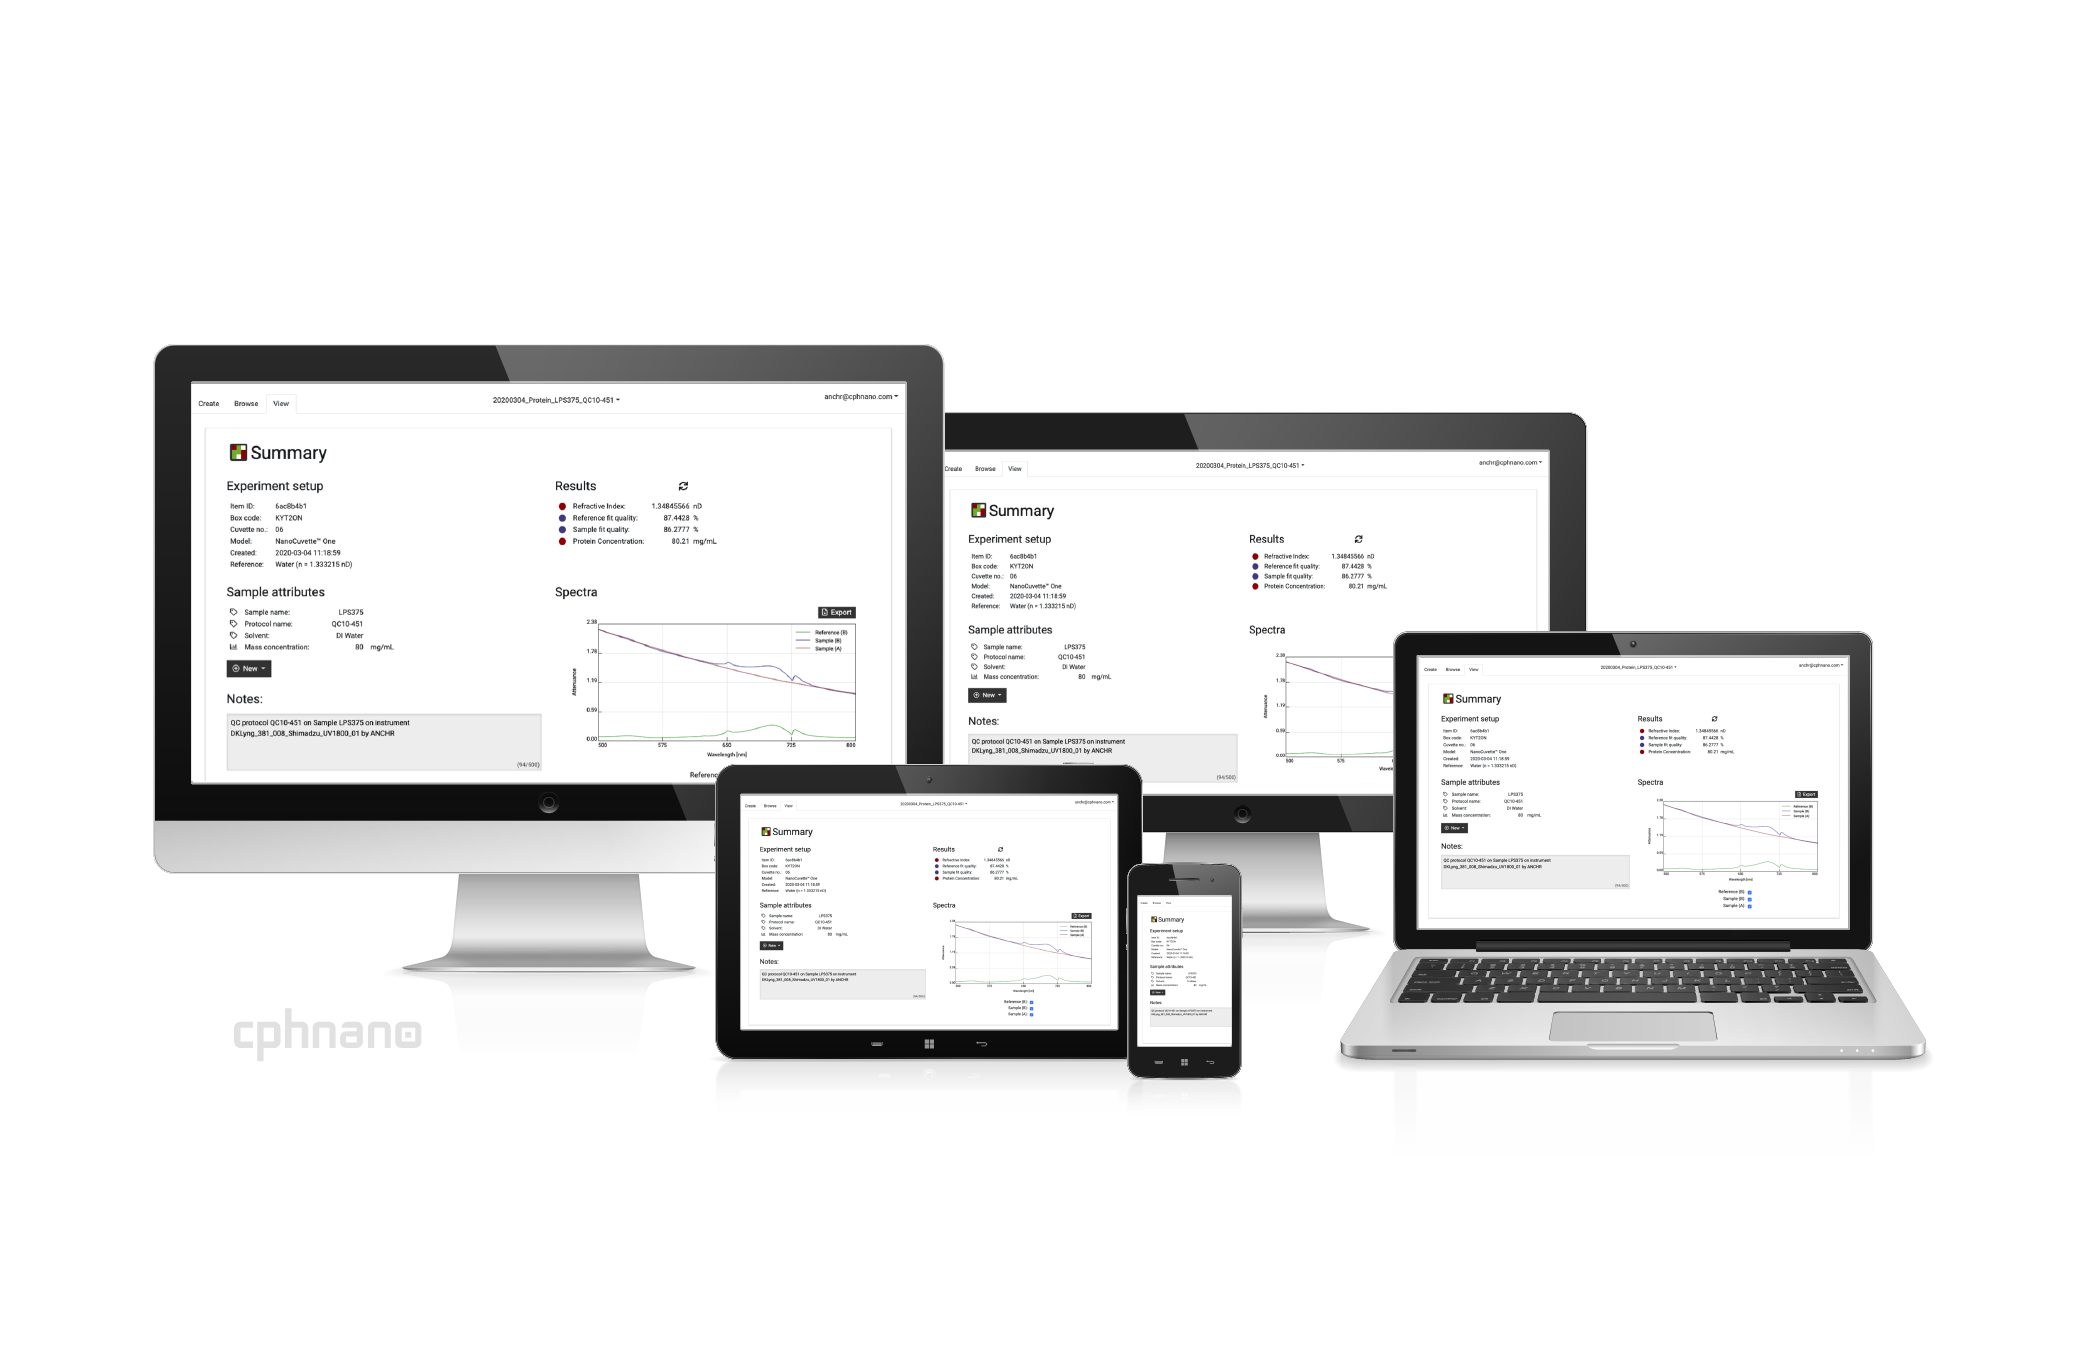
The most User-centric Cloud UV-Vis Software
Versatile, Robust and Feature-packed
SUPPORTS YOUR HARDWARE
SpectroWorks™ works with your existing UV-Vis spectrophotometer.
DESIGNED FOR HUMANS
Easy to use with no special training required. Online support included.
ACCURATE AND INSTANT RESULTS
Results are calculated based on spectral analysis and it is incredibly fast.
SAFE AND SECURE
SpectroWorks™ uses the up-to-date web technologies to ensure your data is secure.
Auto-generated Reports
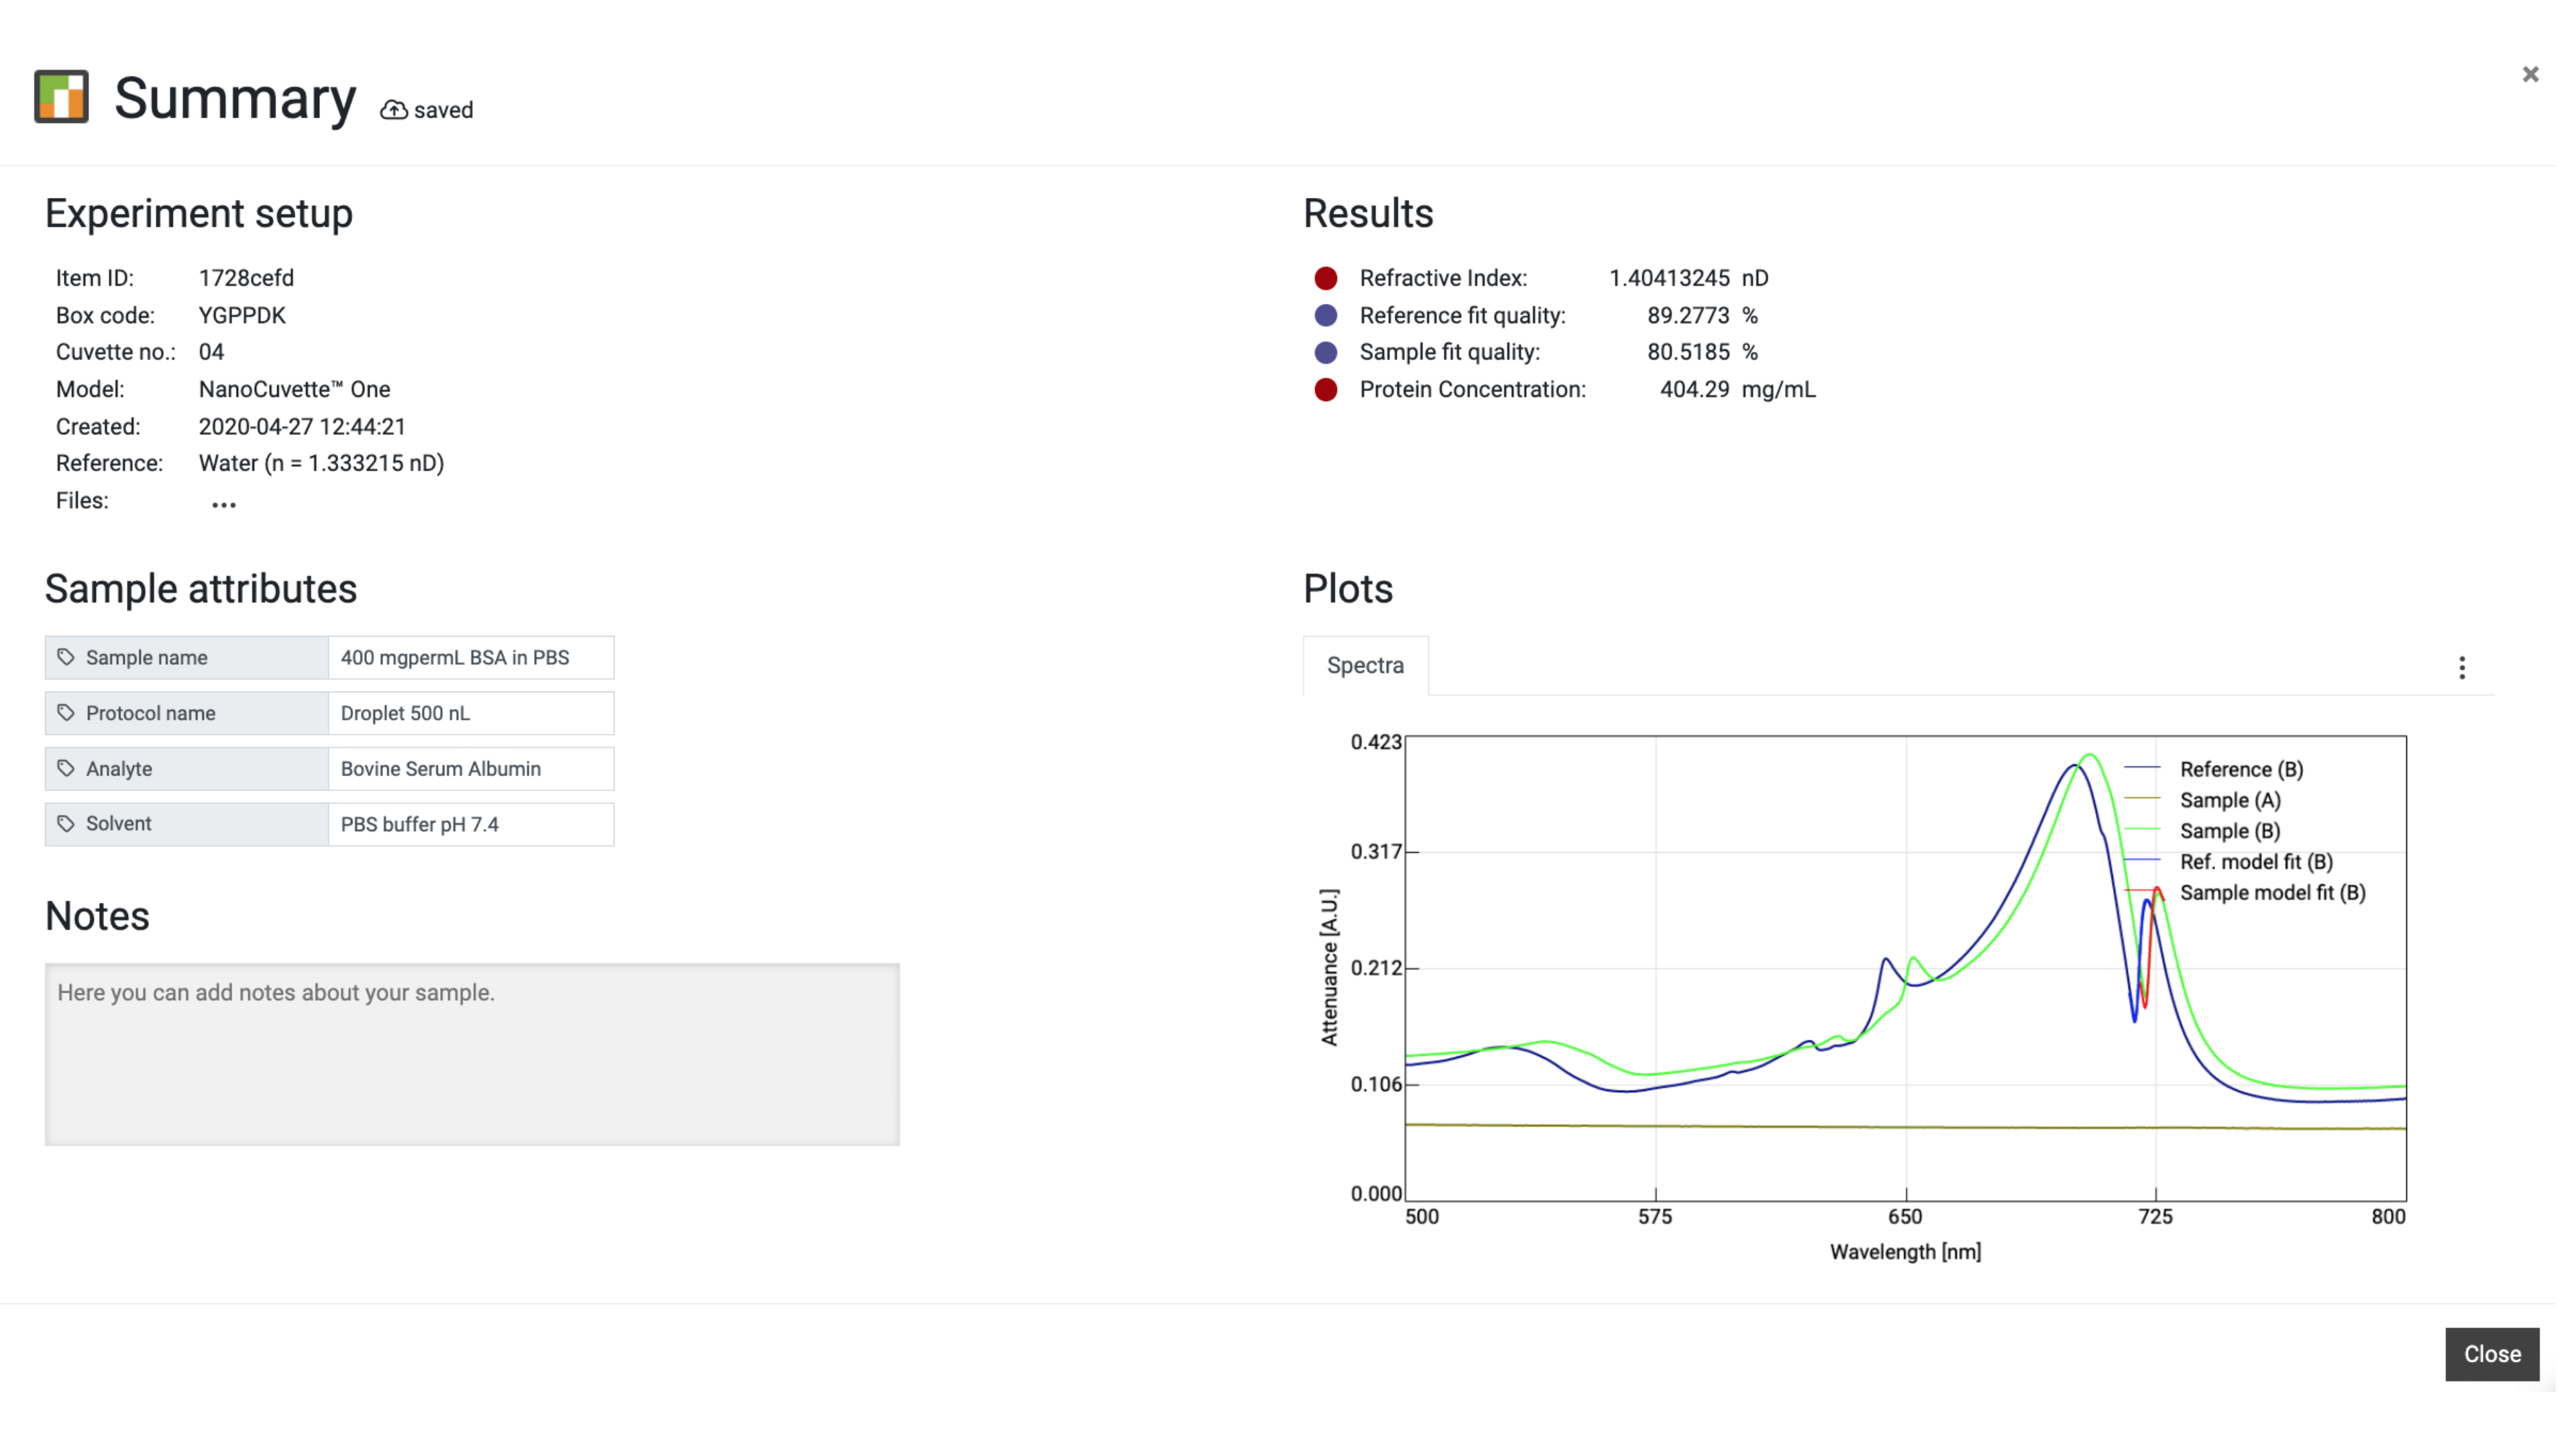
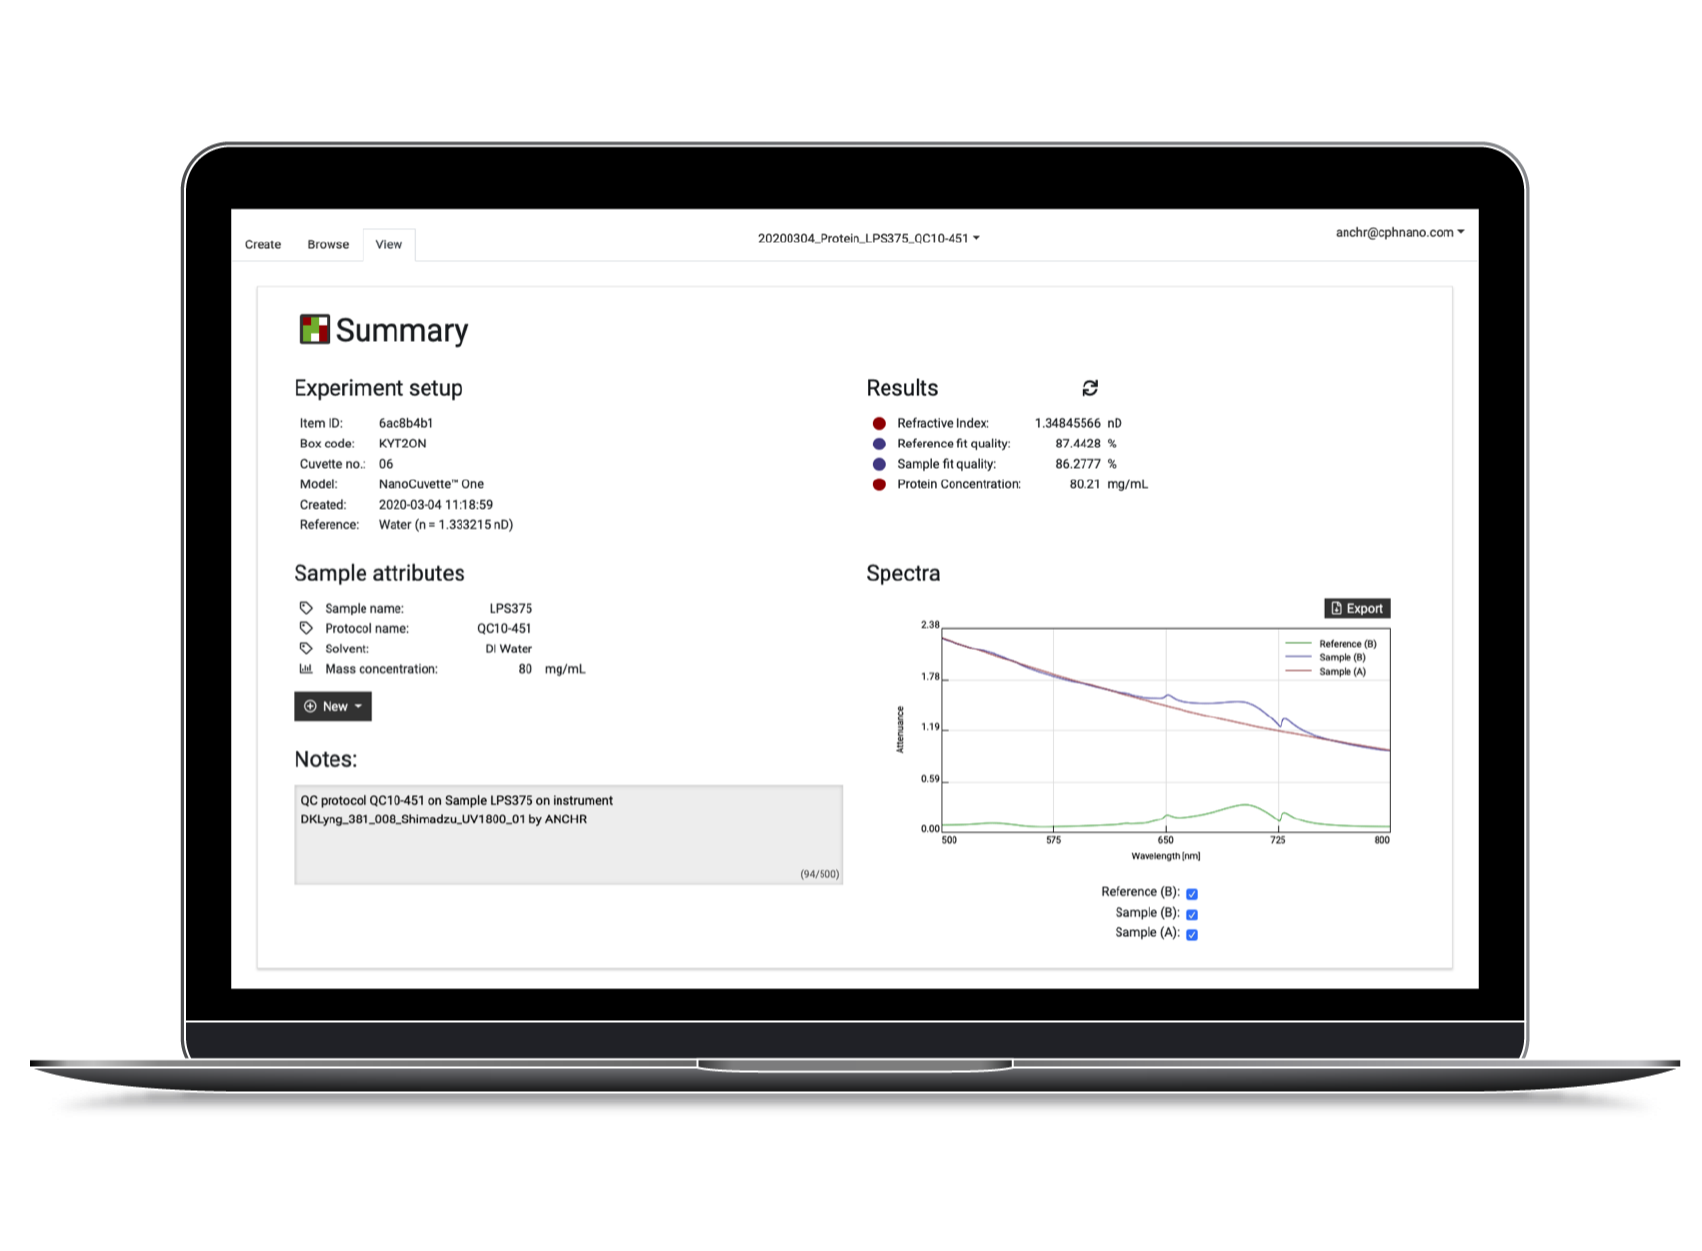
SpectroWorks™ elegantly displays the findings from a measurement flow
At the end of a measurement flow a summary window will show up with information about the experiment setup used, results from the flow and a plot area with various plots from the flow. It is always possible to edit which plots are shown and its data can be exported directly to a csv file found in the top right menu button of the plot area.
To keep track of what was used in the measurement, it is encouraged to enter all sample attributes and if needed, there's a section for adding notes.
Create Custom Application Specific Notebooks
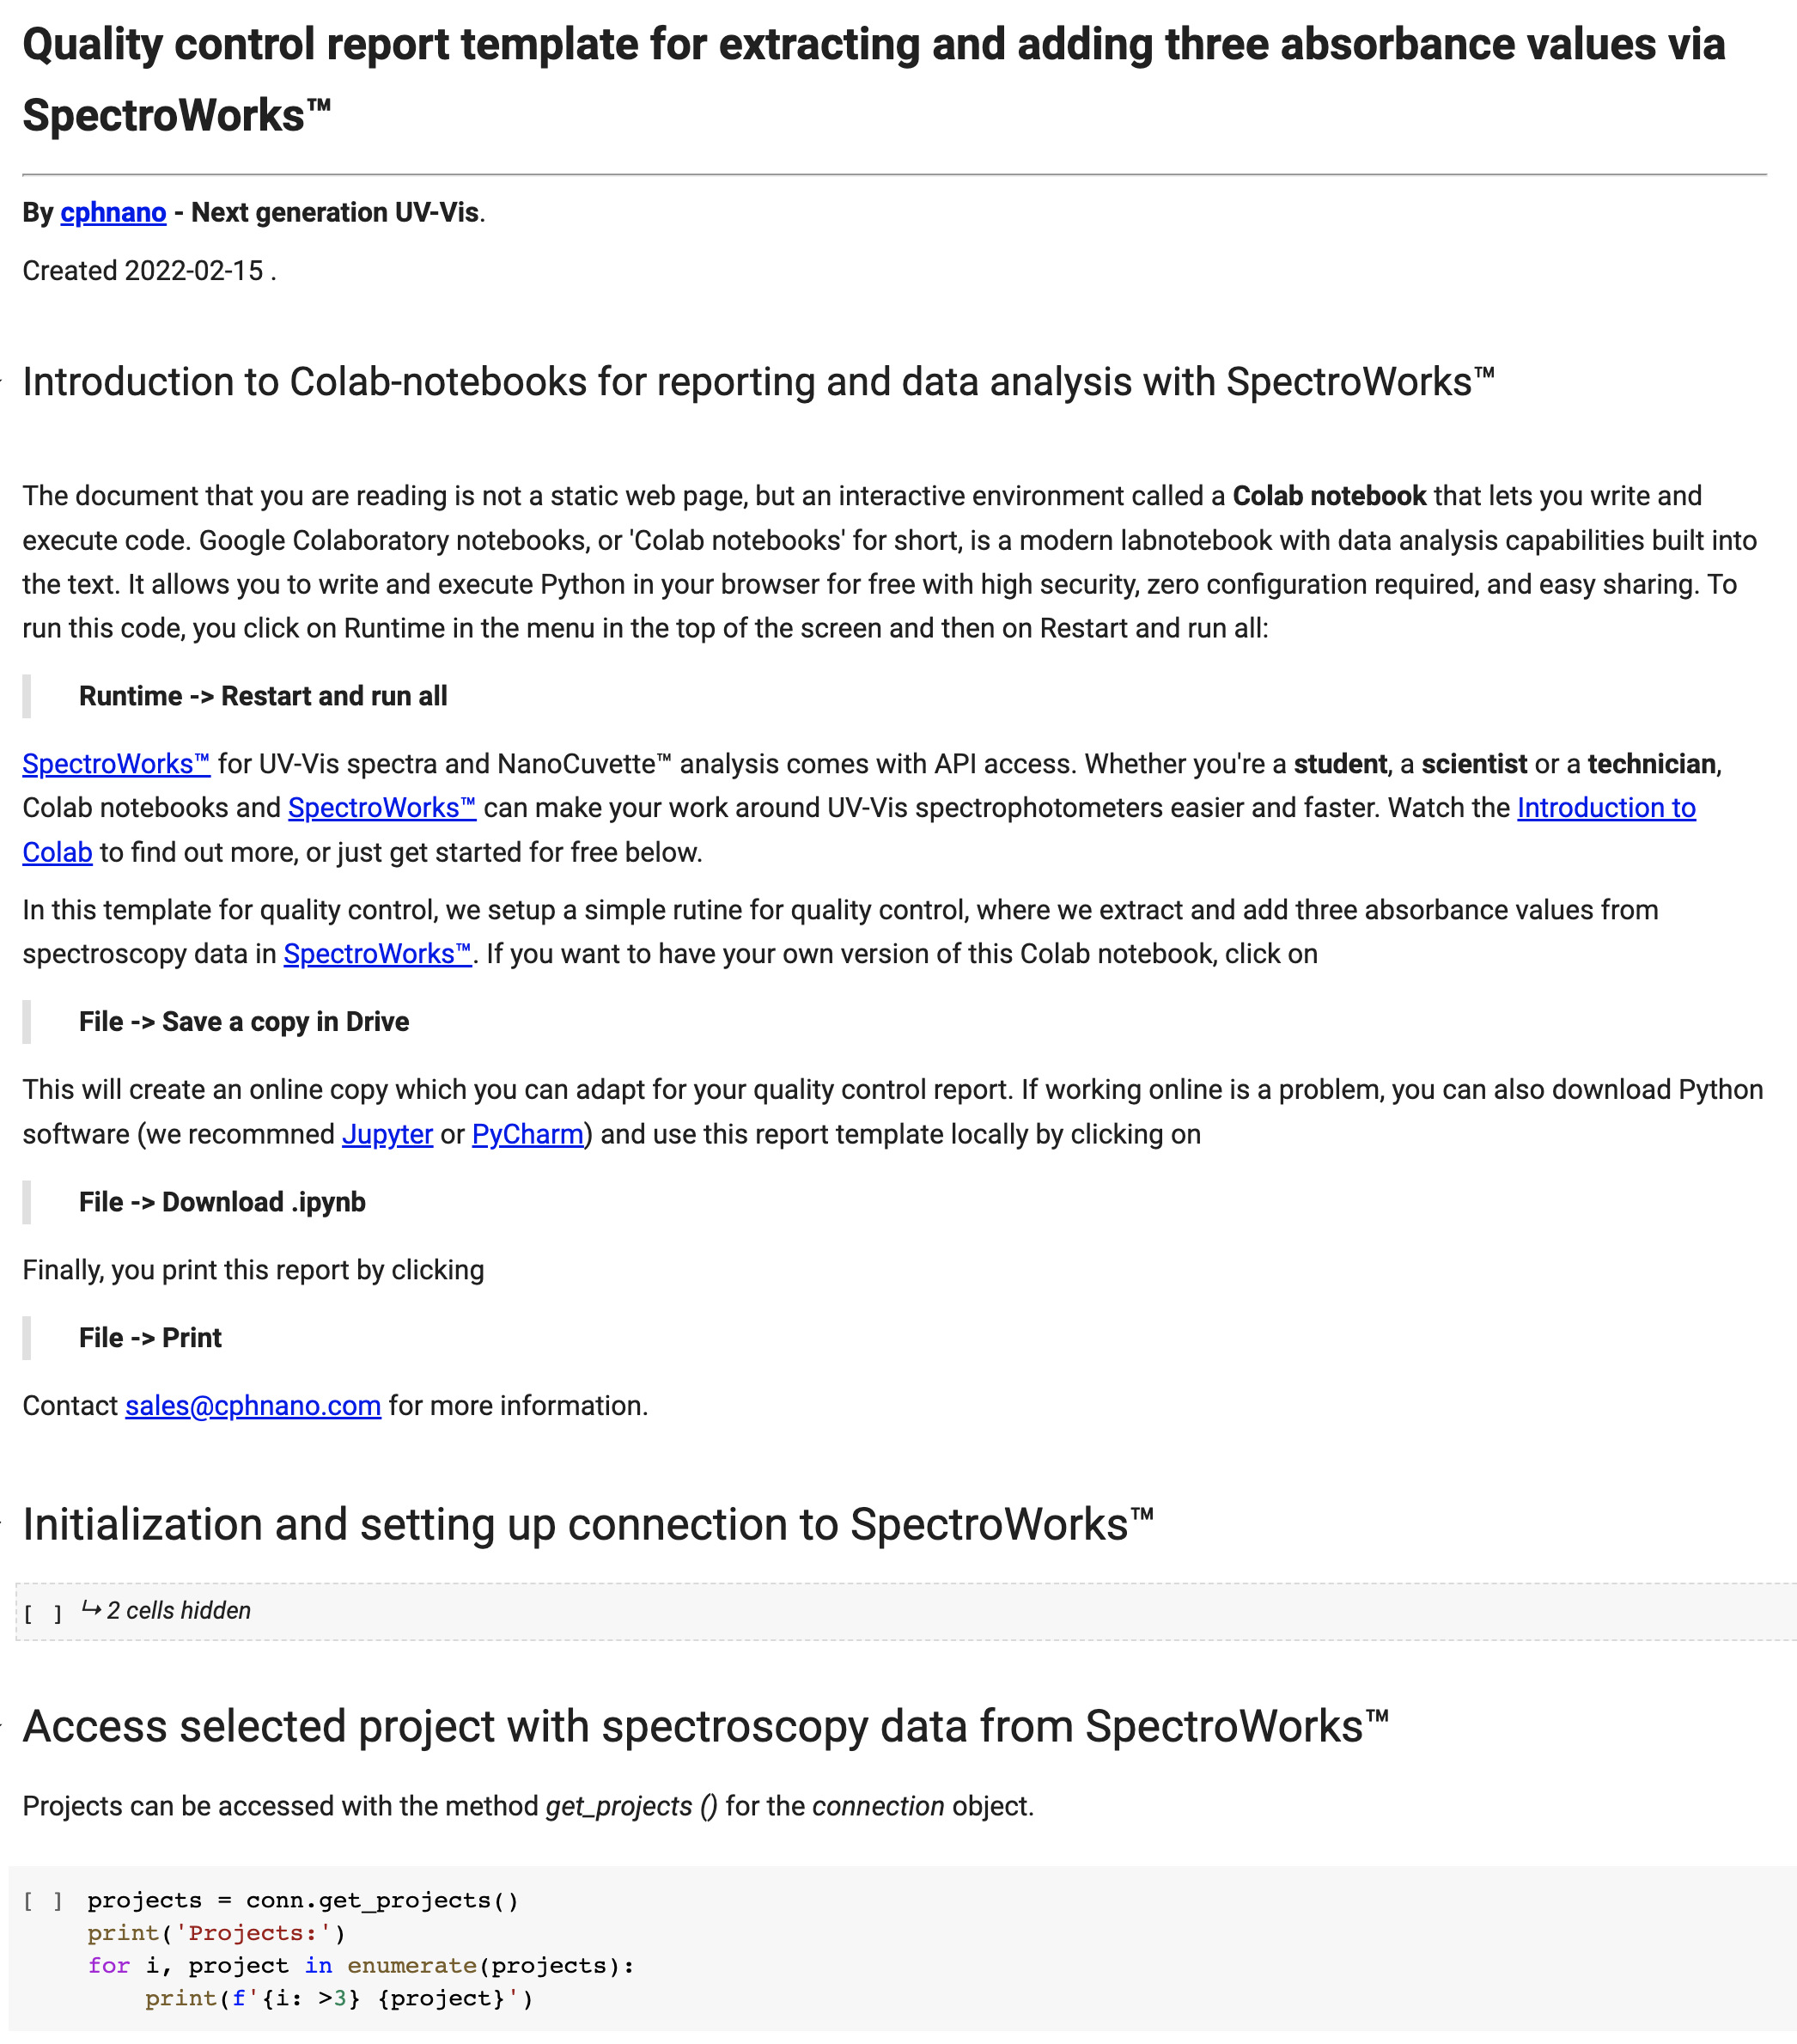
SpectroWorks™ supports the ability to share its data to any 3rd party tool via API keys. Access all projects or select the ones needed to perform further analysis depending on the application. We use Google Colab and provide report templates, quality control templates, standard curve report template etc.
We provide custom notebooks and consultancy for your specific needs
We are constantly adding more templates for various applications and use cases. However, if there's something specific that you need for your application, we do offer to make a custom notebook as a consultancy service.
Contact us here to learn more about the possibilities and how we can upgrade your workflow for your specific application.
